‘Graphs of Note’ is an occasional series of blog posts that describe interesting and informative graphs and the stories behind them.
Much has been written about the limitations of the Impact Factor and its use as a metric of journal quality. In a 2015 editorial in The EMBO Journal, Chief Editor Bernd Pulverer wrote that one of the problems with the Impact Factor is that it is based on a mean whereas the underlying citation distributions can actually be highly skewed.
The breadth of information contained within a journal’s citation distribution was one of the key lessons I learned as a new editor. Early in my career, I was responsible for a journal with an Impact Factor that placed it towards the wrong end of the rankings. One of my jobs was to secure the future of the title, and the growing importance of the Impact Factor among potential authors meant I had to tackle this issue. Hot off a postdoc, I explored the new world of data that was now at my fingertips – the Web of Science database.
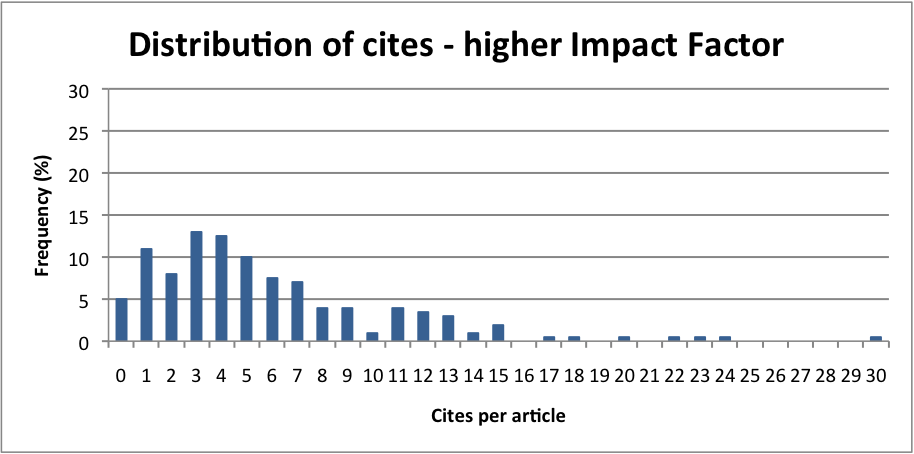
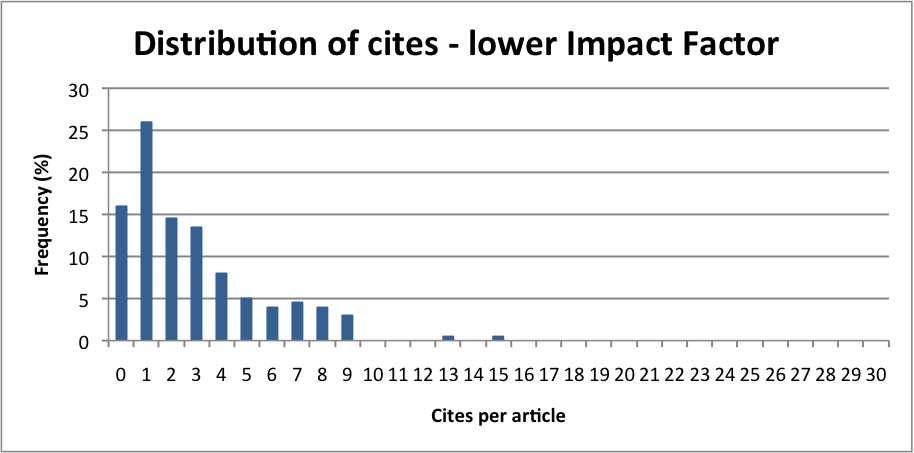
I found that it was possible to extract the number of cites per article for any given period; I chose two years to match the Impact Factor window. I collated the data and plotted the frequency of cites per article. I repeated the task for a number of other journals in the same category. For the journal I was responsible for, and some others, the distribution was skewed to the left, with plenty of papers that didn’t cite, or cited only once or twice. For other journals, the distribution was flatter, with the peak of the curve shifted to the right.
It struck me that I could, with a good degree of certainty, judge the general characteristics of a journal from its citation distribution. Clearly, those with skewed distributions and peaks to the left would have lower Impact Factors than those with more even distributions and peaks to the right. But sometimes even high Impact Factor journals had a larger proportion of zero-citing articles than might be expected.
For other journals, there were one or perhaps two papers that had hit a citation sweet-spot. This is very important for journals that only publish a small number of articles each year, given the method for calculating the Impact Factor: a few highly citing articles in a small journal can be responsible for the majority of the Impact Factor. It soon became clear that Impact Factor does not account for variability among a journal’s articles. I concluded that the leading journals in the field were not just the ones with a high Impact Factor, but those that consistently published many high-citing articles and maintained this over a sustained period.
So one should be wary of the Impact Factor, as the devil is in the detail. Rather than chase a number, to improve the journal it is far more constructive to concentrate on the basics of attracting better and more interesting papers through all the means available to an editor. However, I did use citation distributions to analyse my journal and benchmark it against others in its field. I could also use the citation distribution as a tool to track journal performance over time – as the peak shifted to the right and the number of high-citing papers increased, I knew I was on the right track.
Author: Dugald McGlashan